Interviewer: Milan Budhathoki, GIS and Data Librarian, University of Maryland College Park
This interview is part of our Researcher Interview series that spotlights some of the interesting work being done using maps/GIS data at the Big Ten Academic Alliance institutions.
Researcher Bio

Matthew McLaughlin (Matt) is a senior lecturer and mixed media artist in the College of Arts and Humanities at the University of Maryland College Park. Through his artworks, Matt explores the human relationship with their environments, particularly urban and suburban spaces, and examines how we interact with and observe the spaces we inhabit and modify to fulfill our wants and needs. By manipulating images/maps and re-contextualizing symbols, his work generates fresh spatial perspectives for viewers to contemplate when they confront their own connections with the environment.
Webpages:
- www.matthewtmclaughlin.com (personal website)
- https://art.umd.edu/ (department website)
How have you been incorporating maps and spatial perspective into your research and teaching?
Matt: I have been working with maps and spatial perspective in my work since my undergraduate studies at Ringling College of Art and Design. I can remember a piece where I inkjet-printed a map of the local area onto printmaking paper and then screen printed an image on top that mixed the two together to obscure an understanding of either image. The image on top was an abstracted line drawing of a homeless person who lived near campus. I was trying to make a statement about how many of the individuals who are homeless disappear into the space around them to most people who pass by.Through undergraduate and graduate studies, I continued to make one-off projects here and there that referenced maps and mapping imagery. It wasn't until 2019 that I started to create more prolonged projects using mapping imagery. Since then I have been working on a number of series that explore mapping imagery in different formats and directions.
Old Man’s Proposition
 |
| Figure 1: Old Man's Proposition; 32"x20", mixed media collage, 2020; a mixed media collage that references both congressional district mapping and constellation creation to reference the narratives we create to understand mapping imagery. |
Is there a specific type of map that you use in your work? What format of maps do you use, such as print or digital?
Matt: There is not a specific type of map that I use in my work. My work is more about approaching the use of maps and mapping imagery through different relational and philosophical aspects. One book that heavily influenced some of my research is Mark Monmonier's "How to Lie with Maps Vol. 3." The general public takes maps and the information they gain from them for granted and expect that the maps they reference will always be truthful. But the reality is that there is nothing that stops a map creator from giving people incorrect information other than their personal integrity. I find it fascinating that as a society and culture as a whole, maps have an innate sense of truth that cannot be questioned. Yet, as with so much information we are presented with on the internet, and in the daily course of life, we should naturally question it to make sure we are getting factual information.I find myself working with mostly digital versions of maps because it allows more flexibility in how I approach using them in my studio practice. But that being said, many of the digital versions of the maps I reference are from photographs or scans of printed maps throughout history.
Where do you acquire maps? What software do you use to process them? Does a data/map discovery portal like the BTAA Geoportal play a significant role in finding and selecting maps for your work?
Matt: I acquire maps for my work through various sources. Alongside utilizing the University of Maryland collection, I search different online databases and have a small collection of my own atlases that I have purchased at different points in time.Most of my work involves using Adobe Illustrator to process the aspects of the maps that I want to directly reference in my pieces. Using illustrator to create files based on different graphic elements allows me flexibility in thinking about what process I might use for outputting the information. An Illustrator file can allow me to print a film of a file, but also output the file through a vinyl cutter, laser cutter, or other new digital tools for different applications.
I have not used many data/map discovery portals for my research but that is not to say I will not. Currently I am focused on working through the University of Maryland collection, but I can see myself utilizing the BTAA Geoportal in the future.
DALL.E Gromatici #1
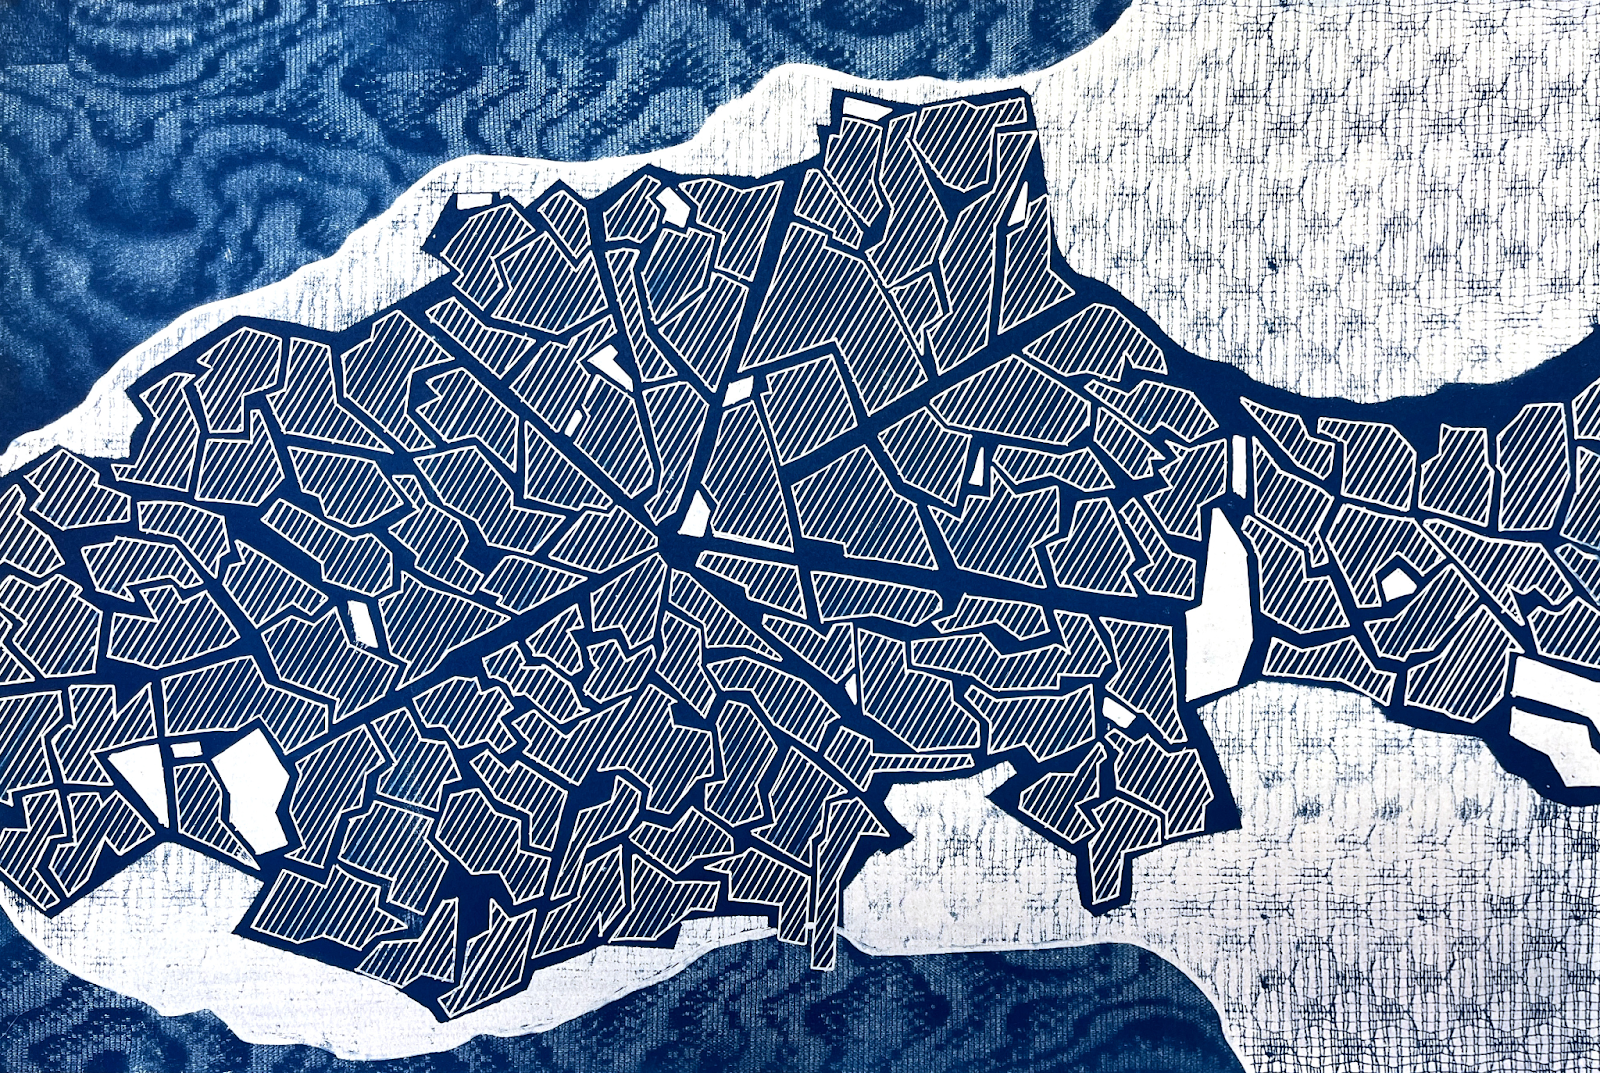 |
| Figure 2: DALL.E Gromatici #1; 14"x21", cyanotype, 2023; a cyanotype inspired by a DALL.E prompt while referencing the historical use of cyanotypes for making maps in the late 19th century. |
How do you publicize your work to ensure that a broader audience can benefit from it?
Matt: I have exhibitions of my work in galleries and art spaces a few times a year. For example, I had an exhibition this past April at the Athenaeum in Alexandria, Virginia. I have two more solo exhibitions planned for 2023 as well as one planned for early 2024. I am also exhibiting in different group exhibitions throughout the year as I get my works accepted into them.Beyond physical exhibitions, I have a website I post my work onto and I am active in the use of different social media platforms, like instagram, where I post images of my process and works along with descriptions of the pieces.
Could you please briefly describe your current project and how you plan to utilize the map collection at UMD Libraries?
Matt: My current project with the University of Maryland map collection is funded through the Clarvit Research Fellowship through the Department of Art in the College of Arts and Humanities at UMD. For my research I am working through the UMD collection looking for interesting graphic elements in the maps. I will be documenting the elements and creating a visual library for myself that will contain all the graphic elements.With this visual library I will use the elements as layered aspects of new prints and paintings that will work towards creating pieces that are abstract in nature but recognizable through their mapping elements. In essence the goal is to make works that seem understandable because of the recognizable nature of the mapping graphics, but through layering, texture, and color the works will not be readable as maps. Instead they will have the feeling of maps, but be too abstract to give the viewer the typically easy understanding of information that maps offer.
Balancing Act
 |
Figure 3: Balancing Act ; 32" x19", mixed media collage, 2021 |