Data-Driven ArcGIS StoryMaps
How to Create a Story Map by Batch Attaching Media to Points Using ArcGIS StoryMaps
By Jay Bowen, University of Iowa Libraries
Tags: ArcGIS StoryMaps, data-driven, map tour, batch attachment, images, spreadsheet, csv
Overview
There are a lot of questions on the GIS Q&A sites about how to create a story map from a spreadsheet of point data with images using the newer version of ArcGIS StoryMaps, but very few answers. If you are like me, you liked how Esri's Classic Story Maps allowed you to upload an entire csv of points with image urls to create a data-driven story map in one quick step without having to do this point-by-point. You may have agonized over this process in the newer version and you might be unaware that, by implementing a few extra steps using ArcGIS Desktop, you can also do this with the newer version. In the post that follows, I will walk you through the steps involved so that you can create a data-driven tour in ArcGIS StoryMaps using a csv spreadsheet and a folder of downloaded images.
For this task, you will need:
ArcGIS Desktop
ArcGIS Online
A csv spreadsheet containing point names, descriptions, image names, and coordinate data
A folder containing the images you want to use
Step One: Download the Data
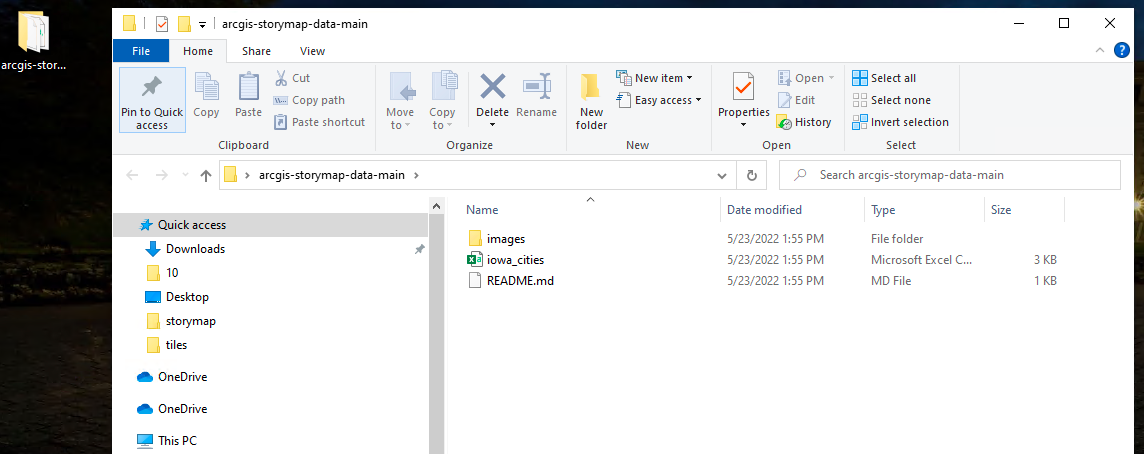
You can download a folder containing a sample spreadsheet and images by clicking here. Save this folder to your desktop as shown below. Notice that the csv contains a column with image names that match the jpg files in the images folder.
Step Two: Open CSV in ArcGIS Desktop as XY Data
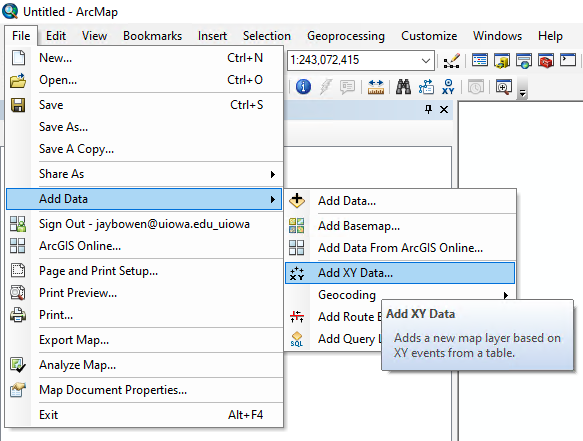
Now open ArcGIS Desktop and click File > Add Data > Add XY Data as shown below.
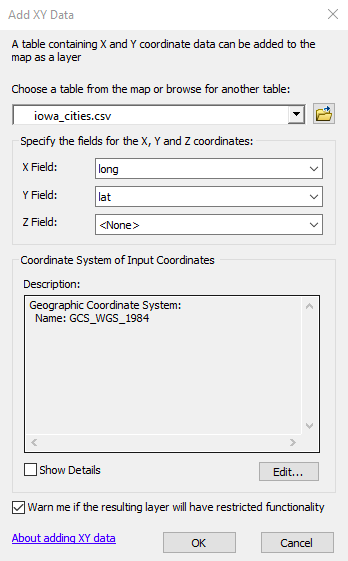
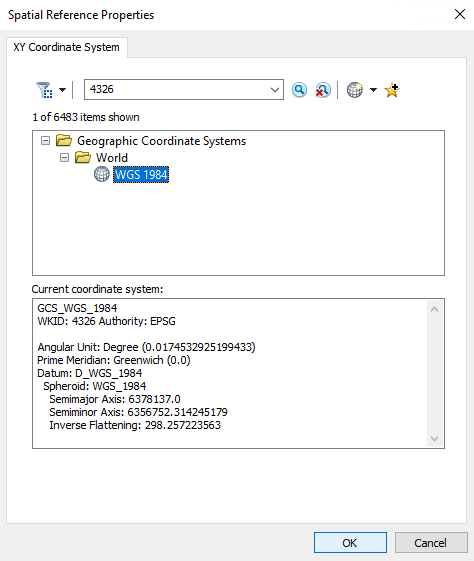
Next, fill in the dialog box as shown below at left. Browse for the iowa_cities.csv in the folder you downloaded to your desktop and use this as the input table. For the X Field, make sure you have selected the "long" column from the table. Likewise, for the Y Field, make sure you have selected the "lat" column from the table. Most importantly, you need to designate the coordinate system of the input coordinates by clicking "Edit" and searching for "4326" or WGS 1984.
You should now see the points in your map window. Add a basemap and confirm that the points correspond to the correct Iowa cities. Now we need to store these points in a geodatabase.
Step Three: Export Points to a Geodatabase
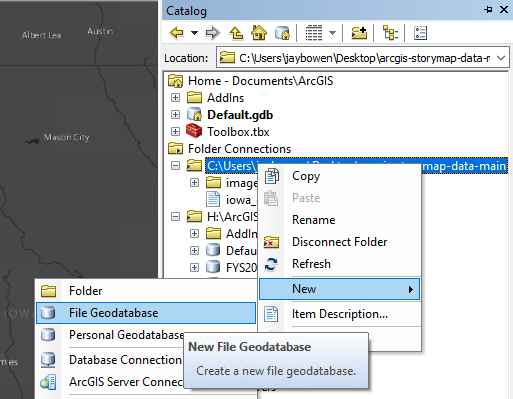
First, open ArcCatalog and connect to a folder where you would like to create a new file geodatabase. I am connecting to the folder that we saved to Desktop. Now, right click this folder and click New > File Geodatabase, as shown below. Rename this geodatabase IowaCities.gdb.
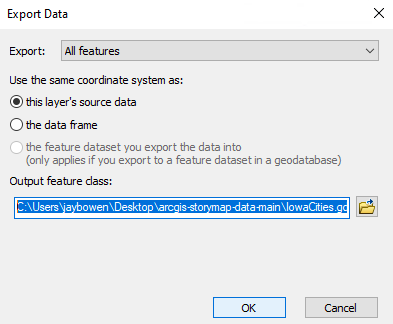
Now, right click iowa_cities.csv Events in the Table of Contents and click Data > Export Data. In the dialog box that opens, in the text box under the output feature class options, add the path to your new geodatabase and a name for the new feature class that will go there. For example: C:\Users\
yourusername\Desktop\arcgis-storymap-data-
main\IowaCities.gdb\iowa_cities. Add the exported feature class to your map.
Step Four: Enable Attachments
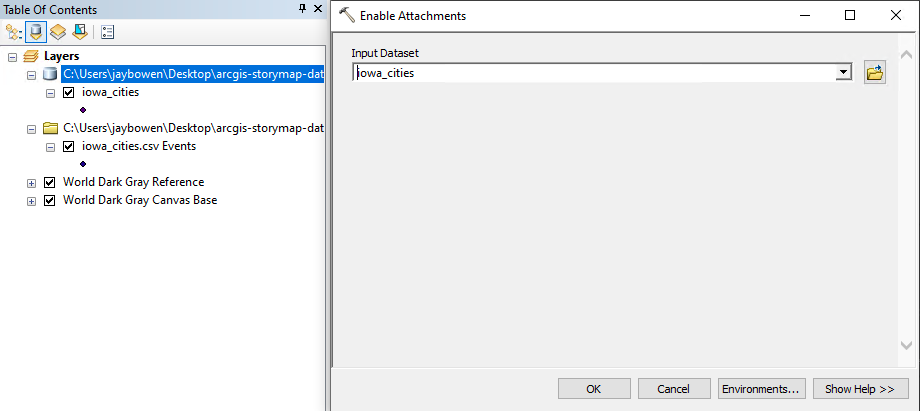
Next, search for and open a tool called "Enable Attachments." Add the new iowa_cities points feature class from the new geodatabase as the input dataset as shown below. Click OK and wait for processing to complete.
Step Five: Generate an Attachment Match Table
Now, find and open another tool called "Generate Attachment Match Table." The input dataset is your iowa_cities feature class from the geodatabase. The input folder refers to the folder where the images are stored. We saved this to our desktop at the beginning. The output match table is the name of the table we will create with this tool. I am calling this "iowa_cities_match_table." Make sure to save this in the geodatabase. Finally, the key field is the column from the input dataset containing all of the image names corresponding to those in the image folder. Have a look at the screenshot below for help. Click OK when ready.

Step Six: Add Attachments
Now we are ready to add the images from our image folder as attachments to the appropriate points. Search for and open the "Add Attachments" tool and fill out the dialog box as follows. The input dataset is your iowa_cities feature class from the geodatabase. The input join field is the numeric id column from the input dataset. The match table is the table you created in the preceding step. The match join field refers to the matching numeric id column from the match table. The match path field is the name of the column in the match table containing the names of the images to be attached from the image folder. Finally, the working folder is the path to the desktop folder where all of the images are saved. Click OK.

Step Seven: Publish Points as a Service on ArcGIS Online
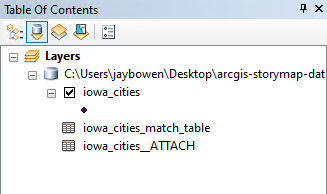
Important: You must make sure your Table of Contents contains only the points, attach table, and match table as shown in the image at right. All other data, including basemaps, must be removed before this step. Save.
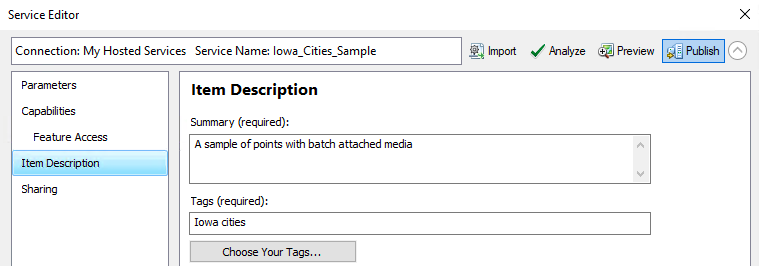
Click File > Sign In… and complete the sign in dialogue. Once signed in, return to ArcGIS Desktop and click File > Share As > Service… and then click Publish a service > Next. Name the service "Iowa_Cities_Sample" and click Continue. In the dialog box that follows, you need to click the "Item Description" tab and add a summary and tags. For summary, you can just input "A sample of points with batch attached media." For tags, input "Iowa cities." Now click "Publish" as shown in the following image.
If this doesn't work, you can click "Analyze" to get a report of any problems. You may need to open a new map with only the necessary data before you attempt to publish a service.
Step Eight: Publish an ArcGIS StoryMap Tour from the Published ArcGIS Online Feature Service
If you are able to publish the data successfully, navigate to the ArcGIS StoryMaps sign in page and sign in. Click New story > Start from scratch. Give your story map a title and a subtitle. Then, click the + button next to "Tell your story…" and click Map tour. You will see three options. Choose "Start with a feature service" and select the "Iowa_Cities_Sample" feature service you just published. Once you have done this, you should notice that your points have been added along with the associated images, as shown below.
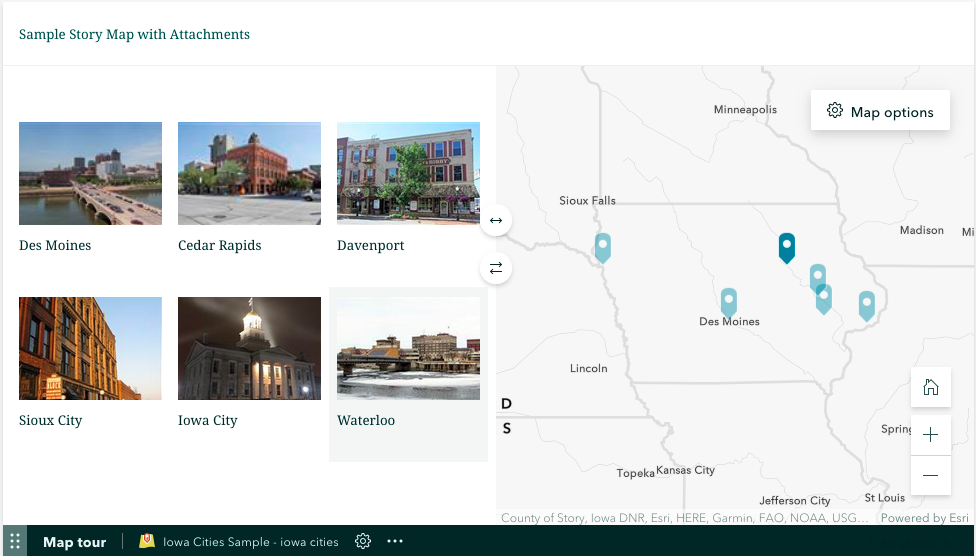
Also notice how the story map automatically fills out the sidebar with the data from the name and description columns.
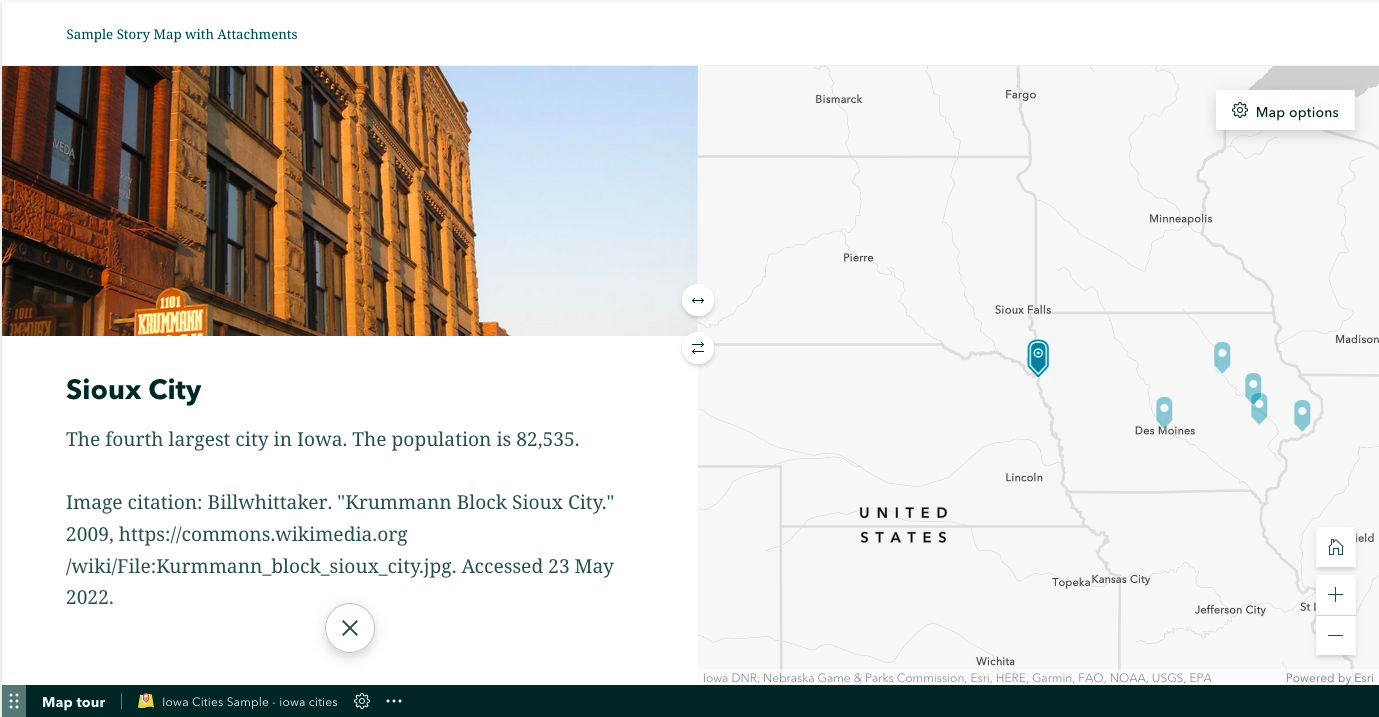
Admittedly, this is a bit of work for only six points, but you can see how this process would be helpful if you had a prepared spreadsheet with many points and did not want to add this content point-by-point. I hope this post saves you the hours of rummaging through GIS help pages that I subjected myself to before finding this solution. Enjoy!