An Interview with El Lower, GLANSIS Research Associate at Michigan Sea Grant (University of Michigan)
Interviewer: Caroline Kayko, Map and Geospatial Data Librarian, University of Michigan
Michigan Sea Grant logo

This interview is part of our Researcher Interview series, spotlighting the work being done creating and using GIS data at the Big Ten Academic Alliance institutions.
Name: El Lower
Title: GLANSIS Research Associate
Department/Center/Unit: Michigan Sea Grant, SEAS
Preferred Web Link for department directory page or center/lab page: https://www.glerl.noaa.gov/glansis/index.html
Background: The Great Lakes Aquatic Nonindigenous Species Information System (GLANSIS) is a NOAA-led inter-agency database designed to be a "one-stop shop" for information about introduced aquatic species in the Great Lakes. The database hosts information on identification, ecology, distribution, risk assessments, management strategies, and more for 180+ aquatic invaders in the region, and operates in partnership with Michigan Sea Grant and University of Michigan's School for Environment and Sustainability along with many other organizations.
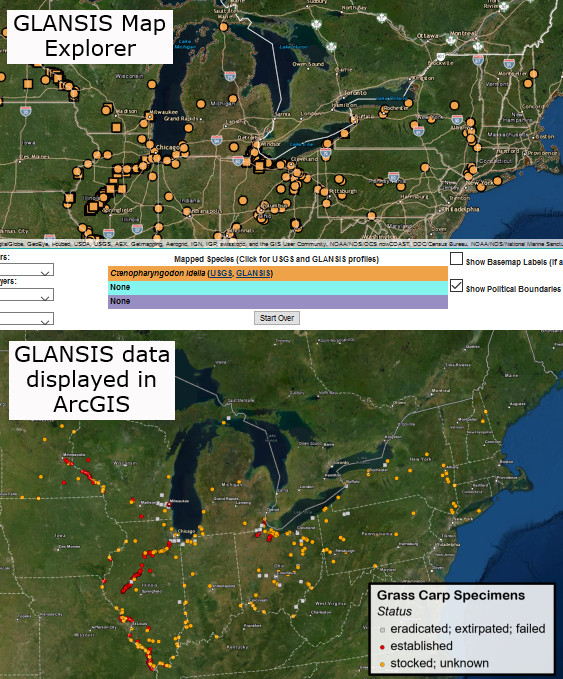
Grass carp shapefile displayed in ArcGIS Online
How do you use GIS in your research/teaching?
Mapping data is a major part of our work at GLANSIS! We host thousands of specimen records tied to geographic coordinates indicating where non-native aquatic organisms have been spotted, and have data-sharing agreements with large regional databases like EDDmapS, MISIN, iMapInvasives, iNaturalist and more to be sure we're up to date on recent sightings. Some of the first sightings of these invasive species go back to records from the 1800s, so we're a treasure trove of historic distribution data as well. For instance, here's a gif showing the distribution of each of the species we track over the last two centuries: as you can see, we've got our work cut out for us...
Combined reports of each species tracked by GLANSIS over the last 200 years
What spatial data do you use or create?
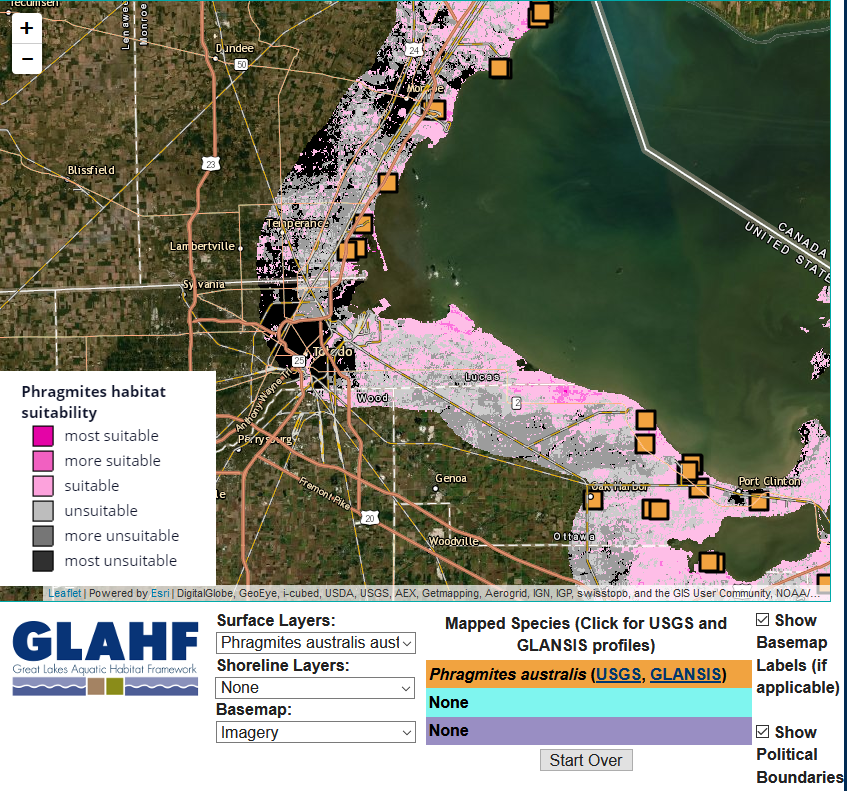
One of the flagship tools we have at GLANSIS is the Map Explorer, a data visualizer which allows users to create their own custom maps of species records in specific geographic locations and compare them with other species, aquatic habitat layers, or even create animated maps like the one above to show the distribution of the same species over time! Users can also download the results of their queries in comma-delimited format to use in the GIS program of their choice to further customize the design of their resulting map. You can try the GLANSIS Map Explorer for yourself here: https://www.glerl.noaa.gov/glansis/mapExplorer.php
Example of GLANSIS database habitat suitability overlay
How do you incorporate students in your research?
We work with a number of student interns and fellows, including partnerships with student groups through University of Michigan's School of Information, the Cooperative Institute for Great Lakes Research (CIGLR), Michigan State University summer fellows, and other seasonal internships. Past student projects have included everything from researching non-native reptiles of the Great Lakes to building a virtual food web using the data we host, and much more.
GLANSIS data is freely available for anyone to use, and we'd love for students to utilize us as a resource for research they might be doing on the Great Lakes! We're also working with teachers and other educators throughout the region to develop classroom activities and lesson plans that combine real-world data in the form of species records with place-based education initiatives, which is very exciting.
How does GIS change how research is conducted in your field?
GIS is such an important part of invasive species management, particularly when it comes to early detection and rapid response efforts -- we rely on accurate, accessible map data shared between our partners and the public to help stop potential biological invasions before they begin. We regularly use spatial data to determine the status of a given species in the Great Lakes -- some of the species we track are native to one part of the US but not others, or even native to one part of the Great Lakes but are expanding their range to others due to climate change or other factors. Knowing their original range and using spatial data to track their spread helps inform the environmental management decisions that follow.
What research avenues are you most excited about? What are the trends/future of GIS in your field?
GLANSIS has always relied on map data as a core component of the information we serve to researchers and the public, but one new aspect of GIS we're beginning to experiment with more is ArcGIS StoryMaps. I love being able to display maps alongside other types of media to create an interactive narrative or tutorial. Our latest StoryMap is a guide to using the GLANSIS Map Explorer, which demonstrates how to use the tool as a built-in data visualizer or download the raw data to use in a GIS program of your choice. We're looking forward to making more!
To learn more, please check out our database at GLANSIS (and its sister site for native species, Great Lakes Water Life), follow us on Twitter at @GLANSIS_news, or contact our program manager Rochelle Sturtevant at Rochelle.Sturtevant@noaa.gov. Happy mapping!
Check out more data about the Great Lakes and the state of Michigan at the BTAA Geoportal.
Have questions about the BTAA Geoportal? Contact our project team!