By Joshua Sadvari and Daniel Dotson
This interview is part of our Data Provider Series, which highlights local governments and institutions that offer open GIS data. In each interview, providers tell us about their missions and data resources. We hope this will be a great way for readers to learn more about local GIS developments and new initiatives.


1) Can you describe MORPC's mission and talk a little bit about how the geospatial data you create support that mission?
MORPC is Central Ohio’s regional council for nearly 75 members comprised of counties, cities, villages, townships, and regional organizations in the 15-county region. We take pride in bringing communities of all sizes and interests together to collaborate on best practices and plan for the future of our growing region. We do this through a variety of programs, services, projects and initiatives – and nearly all of them require some type of geospatial data.
Relevant, timely, and reliable data provides the foundation for nearly all of our work at MORPC. Whether evaluating transportation projects for funding, tracking regional sustainability initiatives, or developing new strategies to meet affordable housing needs, our member communities and partners look to MORPC for access to data and expert, objective analyses.
Public data accessibility is an important emphasis of our work as well. We advocate for making data openly available and accessible, and we strive to do so whenever possible with the data we create and maintain. To make our work more accessible we maintain an open data site, which was upgraded to Esri’s latest HUB platform last year. The majority of the data we create or maintain is available for download in machine-readable format and is highlighted in web maps, to meet the needs of various users. If you’re in the MOOD to check out our data resources, visit our Mid-Ohio Open Data site at www.morpc.org/data.
2) How does MORPC compare with other agencies in Franklin County, surrounding counties, or statewide that produce geospatial data? Are there other agencies in Central Ohio that you often collaborate with on projects, and if so, what do those collaborations usually look like?
Regionalism and collaboration are core tenets to everything we do at MORPC, and our data work is no different. On a daily basis, we work with the Ohio Department of Transportation (ODOT), the Ohio Geographically Referenced Information Program (OGRIP), the Central Ohio Transit Authority (COTA), county auditors and engineers, numerous municipalities and townships, and a host of other partners across Central Ohio. These days, many have their data available for download, which makes compiling local data into regional datasets or breaking state or national level data down to digestible chunks much easier than it was in the past.
Our regional scope does give us a slightly different perspective than most of the organizations we work with. Rather than creating most of our own data, or accessing existing resources that already conform to our area of interest, we frequently find ourselves gathering data from diverse sources, which was often generated for a different purpose, and compiling it to meet our needs. For example, we gather and standardize building permit data from over 30 permitting agencies in the region to inform our population estimates and projections. It is a labor of love, as anyone who deals with data knows, it comes in all shapes, sizes and formats. However, it’s that comfort working with messy and disparate data that allows us to be nimble and creative in working with so many partners and on so many diverse topics that are important to our community.
Collaboration also comes in the form of the quarterly Central Ohio GIS User Group (COGUG) and Regional Information & Data Group (RIDG) meetings we host at MORPC. All GIS professionals and folks who work with data about Central Ohio are invited to participate, and each meeting averages about 45 attendees. It is a great way to network, share information, and help each other with data and technology issues.
Our Greater Franklin County Location Based Response System (LBRS) project, which began 15 years ago, is perhaps the best example of geospatial data collaboration, and has been elevated by Esri as a best practice. The project started as a way to cooperatively maintain an authoritative road centerline and address point file, to reduce redundancy. Eleven addressing authorities in Franklin County have a two-way replica of a versioned map/geodata service. They each edit it remotely and sync changes back to their version of the data at MORPC. The versions are then all reconciled with the parent geodatabase housed at MORPC. This allows the cities to focus on their own data, but benefit from current data surrounding them with the push of a button or an automated script. Over the years this methodology has expanded to include bikeways and sidewalk centerlines.
3) Can you describe what geospatial data, maps, or apps you create? What is your most popular dataset or product?
As our GIS Manager, Cheri Mansperger, likes to remind us, “All data is spatial data!” Given the place-based nature of our work, she’s absolutely right. MORPC has core transportation and planning work that is very data hungry, so not surprisingly, almost all of the data we create or compile ties back to those purposes.
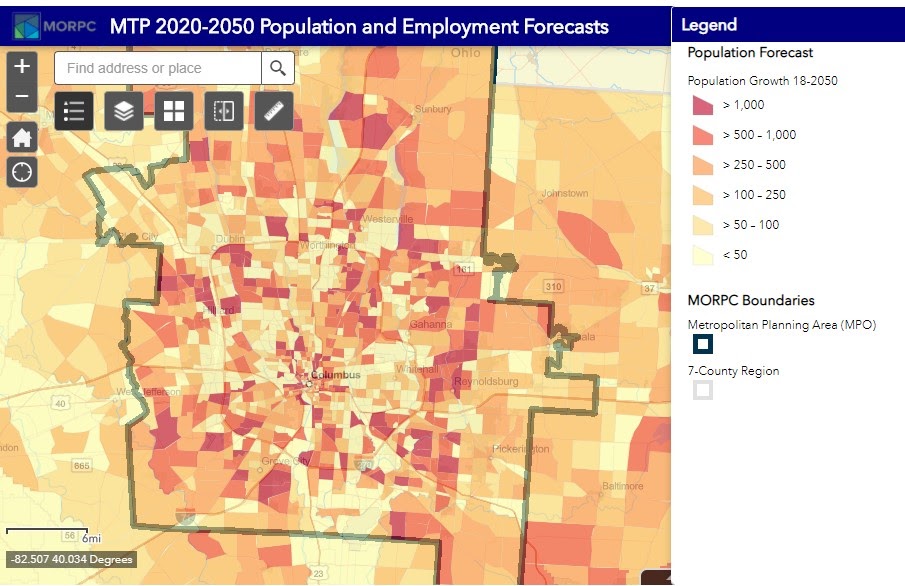
Our long-range Metropolitan Transportation Plan (MTP), which we complete every four years is our hungriest. Any transportation project in our planning area, that will utilize federal funding, is included in the MTP and must be evaluated. Much of the data on MOOD is created because it is an input for, or an output of, the MTP. We track and map proposed development, building permits, bikeways, sidewalks, points of interest, group quarters, existing and proposed land uses and various environmental data. One output of the MTP, via our regional land use model, is sub-county population and employment forecast data for the region for the next several decades.
Beyond just the data, several web apps were also created throughout the MTP process, including a map that allowed the public to draw proposed projects and comment on other proposed projects, as well as a land use review map that was shared with local governments to allow them to provide feedback on our data and forecasts. These apps are very useful both as tools to share data and as vehicles for public and stakeholder engagement. Now that the 2020-2050 MTP is finalized, the web app’s final forecast data, with projections out to 2050, are hosted on MOOD.
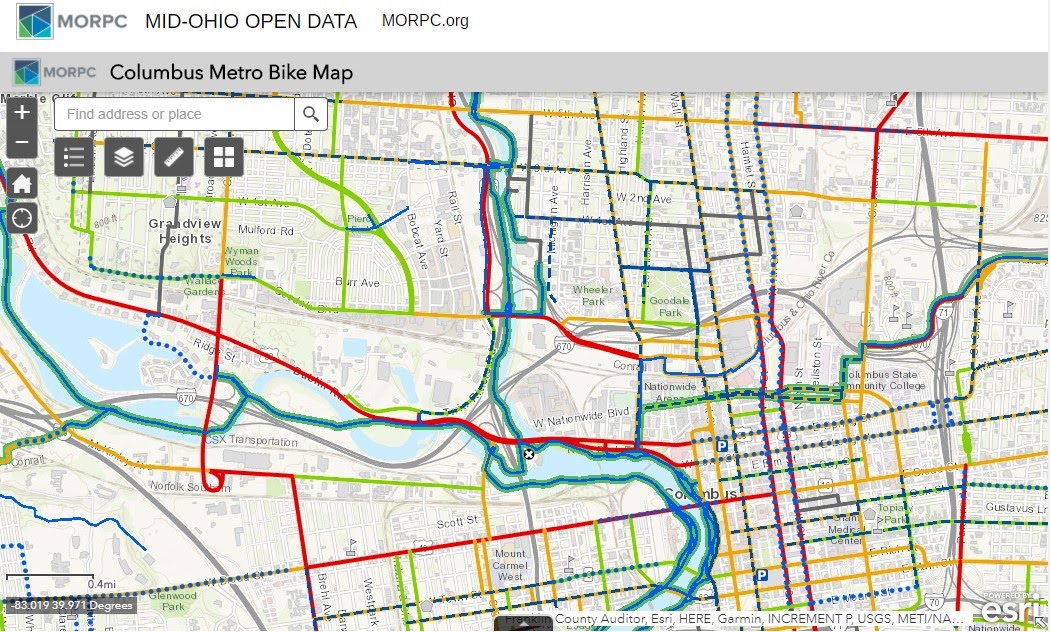
The Columbus Metro Bike User Map is another web app we host and is probably the most popular. We combine mapping of existing bikeways in the region with roads that are coded based on their “level of bike friendliness.”
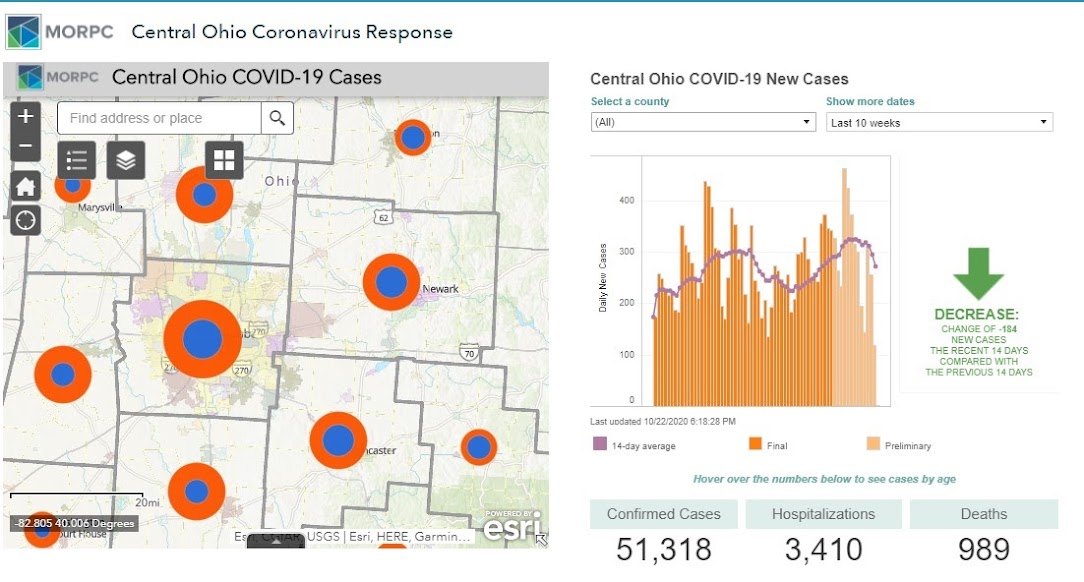
More recently, in response to COVID-19, we created a HUB site dedicated to helping our members navigate the pandemic. It continues to evolve over time, based on needs and requests and data availability. The Esri HUB template and Living Atlas, as well as several automated data feeds our team created, make it easy to maintain and quickly share data. OGRIP also did a great job at making statewide data available. For our purposes we like to zoom in on our region, so it is relatable and easier for our members to consume.
4) Do you know of examples of how your data are being used in an educational context? If so, can you tell us more about that? If not, what would you say to encourage university instructors or students who you think could benefit from using your data in class projects?
One of the interesting things about having data easily available via an open data site is that you don’t know who is downloading it or what they are using it for. If the data is well formatted and has metadata, they don’t even need to ask you questions about it. In the past we used to get more than our share of students calling or emailing for the bikeway, population and employment forecasts, and various other datasets – a sudden influx of requests for the same datasets was a pretty good indicator that a professor had assigned a new project. By making our data more accessible to those who are self-sufficient, our team is better able to assist those who need more hands-on support or who have more complex data needs.
While many professors, researchers, and students access our data without ever interacting with a MORPC staff person, we do work closely with academic partners, particularly at Ohio State. We have a strong and growing relationship with the Center for Urban and Regional Analysis (CURA), which includes development of our recently completed Regional Sustainability Dashboard. Depending on the work, we partner with faculty and staff from across Ohio State, ranging from the Center for Automotive Research; to Planning, Architecture, and Real Estate; to the Sustainability Institute; to the Knowlton School’s City and Regional Planning section, just to name a few. I would encourage students and faculty alike to check out our open data resources or to connect with our team about opportunities to work together.
5) Can you talk about any interesting projects MORPC is currently working on or that are planned for the near future? Are there new initiatives or current events that have altered your data production in any way, or new datasets you intend to distribute that might find their way into the BTAA Geoportal?
We always have something interesting in the works, but a few recent and upcoming initiatives stand out. We recently completed a Regional Housing Strategy to address issues of housing supply and affordability across Central Ohio. Among the substantial data collection and analyses, we developed two new methods and datasets that are particularly unique. One was a housing submarket analysis, which divided all Census tracts in the region into 12 distinct submarket typologies based on their physical and market characteristics. The other was a displacement risk analysis, which identifies areas of the region that are experiencing or at risk of residential displacement due to varying degrees of gentrification. Both of these are first-of-their-kind analyses for Central Ohio and I’m looking forward to the opportunities they create to inform better housing policies and strategies.
Currently we are working on a project to prioritize all of the proposed projects for the Central Ohio Greenways (COG) trail network in Franklin County. Through analysis of our bikeway and road networks, we developed walksheds and bikesheds for the entire existing and proposed COG network. We are now developing a set of indices that can be used to evaluate the relative impact of building any given segment of proposed trail. The indices will measure a diverse range of factors including connectivity, social equity, environment, and the economy.
The geospatial project I am most excited about is one that will get underway before the end of this year. We will be working with Esri and their ArcGIS Urban platform to create a 3D base map and scenario planning tool for Central Ohio. Franklin County will be the pilot area, with plans to expand out to surrounding counties in the future. Using the latest high-resolution LiDAR data and building footprints, we will work with Esri staff to build the base 3D model and incorporate existing land use and zoning data. ArcGIS Urban allows for various planning and development scenarios to be “built” on the base model, and provides robust data analysis capabilities. This tool will help us to visualize and better understand the impacts of potential new developments across the region.
Several partners have come together to help fund the project and are committed to using it in planning efforts going forward; the partners include MORPC, City of Columbus, City of Dublin, City of Westerville, COTA, and Ohio State. Once it is launched, anyone will be able to access and view the model, and any local government with its own ArcGIS Urban seats will be able to contribute their own future plans and development back to the regional model.

Thank you, Aaron for the great interview!
Check out MORPC’s datasets in the BTAA Geoportal here.
Have questions about the BTAA geoportal, or maps and geospatial data in general? Please don’t hesitate to contact our project team!
This interview is part of our Data Provider Series, which highlights local governments and institutions that offer open GIS data. In each interview, providers tell us about their missions and data resources. We hope this will be a great way for readers to learn more about local GIS developments and new initiatives.
Name: Aaron Schill
Title: Director of Data & Mapping
Division/Department: Data & Mapping, Mid-Ohio Regional Planning Commission (MORPC)
Website: www.morpc.org/data
1) Can you describe MORPC's mission and talk a little bit about how the geospatial data you create support that mission?
MORPC is Central Ohio’s regional council for nearly 75 members comprised of counties, cities, villages, townships, and regional organizations in the 15-county region. We take pride in bringing communities of all sizes and interests together to collaborate on best practices and plan for the future of our growing region. We do this through a variety of programs, services, projects and initiatives – and nearly all of them require some type of geospatial data.
Relevant, timely, and reliable data provides the foundation for nearly all of our work at MORPC. Whether evaluating transportation projects for funding, tracking regional sustainability initiatives, or developing new strategies to meet affordable housing needs, our member communities and partners look to MORPC for access to data and expert, objective analyses.
Public data accessibility is an important emphasis of our work as well. We advocate for making data openly available and accessible, and we strive to do so whenever possible with the data we create and maintain. To make our work more accessible we maintain an open data site, which was upgraded to Esri’s latest HUB platform last year. The majority of the data we create or maintain is available for download in machine-readable format and is highlighted in web maps, to meet the needs of various users. If you’re in the MOOD to check out our data resources, visit our Mid-Ohio Open Data site at www.morpc.org/data.
2) How does MORPC compare with other agencies in Franklin County, surrounding counties, or statewide that produce geospatial data? Are there other agencies in Central Ohio that you often collaborate with on projects, and if so, what do those collaborations usually look like?
Regionalism and collaboration are core tenets to everything we do at MORPC, and our data work is no different. On a daily basis, we work with the Ohio Department of Transportation (ODOT), the Ohio Geographically Referenced Information Program (OGRIP), the Central Ohio Transit Authority (COTA), county auditors and engineers, numerous municipalities and townships, and a host of other partners across Central Ohio. These days, many have their data available for download, which makes compiling local data into regional datasets or breaking state or national level data down to digestible chunks much easier than it was in the past.
Our regional scope does give us a slightly different perspective than most of the organizations we work with. Rather than creating most of our own data, or accessing existing resources that already conform to our area of interest, we frequently find ourselves gathering data from diverse sources, which was often generated for a different purpose, and compiling it to meet our needs. For example, we gather and standardize building permit data from over 30 permitting agencies in the region to inform our population estimates and projections. It is a labor of love, as anyone who deals with data knows, it comes in all shapes, sizes and formats. However, it’s that comfort working with messy and disparate data that allows us to be nimble and creative in working with so many partners and on so many diverse topics that are important to our community.
Collaboration also comes in the form of the quarterly Central Ohio GIS User Group (COGUG) and Regional Information & Data Group (RIDG) meetings we host at MORPC. All GIS professionals and folks who work with data about Central Ohio are invited to participate, and each meeting averages about 45 attendees. It is a great way to network, share information, and help each other with data and technology issues.
Our Greater Franklin County Location Based Response System (LBRS) project, which began 15 years ago, is perhaps the best example of geospatial data collaboration, and has been elevated by Esri as a best practice. The project started as a way to cooperatively maintain an authoritative road centerline and address point file, to reduce redundancy. Eleven addressing authorities in Franklin County have a two-way replica of a versioned map/geodata service. They each edit it remotely and sync changes back to their version of the data at MORPC. The versions are then all reconciled with the parent geodatabase housed at MORPC. This allows the cities to focus on their own data, but benefit from current data surrounding them with the push of a button or an automated script. Over the years this methodology has expanded to include bikeways and sidewalk centerlines.
3) Can you describe what geospatial data, maps, or apps you create? What is your most popular dataset or product?
As our GIS Manager, Cheri Mansperger, likes to remind us, “All data is spatial data!” Given the place-based nature of our work, she’s absolutely right. MORPC has core transportation and planning work that is very data hungry, so not surprisingly, almost all of the data we create or compile ties back to those purposes.
Our long-range Metropolitan Transportation Plan (MTP), which we complete every four years is our hungriest. Any transportation project in our planning area, that will utilize federal funding, is included in the MTP and must be evaluated. Much of the data on MOOD is created because it is an input for, or an output of, the MTP. We track and map proposed development, building permits, bikeways, sidewalks, points of interest, group quarters, existing and proposed land uses and various environmental data. One output of the MTP, via our regional land use model, is sub-county population and employment forecast data for the region for the next several decades.
Beyond just the data, several web apps were also created throughout the MTP process, including a map that allowed the public to draw proposed projects and comment on other proposed projects, as well as a land use review map that was shared with local governments to allow them to provide feedback on our data and forecasts. These apps are very useful both as tools to share data and as vehicles for public and stakeholder engagement. Now that the 2020-2050 MTP is finalized, the web app’s final forecast data, with projections out to 2050, are hosted on MOOD.
The Columbus Metro Bike User Map is another web app we host and is probably the most popular. We combine mapping of existing bikeways in the region with roads that are coded based on their “level of bike friendliness.”
4) Do you know of examples of how your data are being used in an educational context? If so, can you tell us more about that? If not, what would you say to encourage university instructors or students who you think could benefit from using your data in class projects?
One of the interesting things about having data easily available via an open data site is that you don’t know who is downloading it or what they are using it for. If the data is well formatted and has metadata, they don’t even need to ask you questions about it. In the past we used to get more than our share of students calling or emailing for the bikeway, population and employment forecasts, and various other datasets – a sudden influx of requests for the same datasets was a pretty good indicator that a professor had assigned a new project. By making our data more accessible to those who are self-sufficient, our team is better able to assist those who need more hands-on support or who have more complex data needs.
While many professors, researchers, and students access our data without ever interacting with a MORPC staff person, we do work closely with academic partners, particularly at Ohio State. We have a strong and growing relationship with the Center for Urban and Regional Analysis (CURA), which includes development of our recently completed Regional Sustainability Dashboard. Depending on the work, we partner with faculty and staff from across Ohio State, ranging from the Center for Automotive Research; to Planning, Architecture, and Real Estate; to the Sustainability Institute; to the Knowlton School’s City and Regional Planning section, just to name a few. I would encourage students and faculty alike to check out our open data resources or to connect with our team about opportunities to work together.
5) Can you talk about any interesting projects MORPC is currently working on or that are planned for the near future? Are there new initiatives or current events that have altered your data production in any way, or new datasets you intend to distribute that might find their way into the BTAA Geoportal?
We always have something interesting in the works, but a few recent and upcoming initiatives stand out. We recently completed a Regional Housing Strategy to address issues of housing supply and affordability across Central Ohio. Among the substantial data collection and analyses, we developed two new methods and datasets that are particularly unique. One was a housing submarket analysis, which divided all Census tracts in the region into 12 distinct submarket typologies based on their physical and market characteristics. The other was a displacement risk analysis, which identifies areas of the region that are experiencing or at risk of residential displacement due to varying degrees of gentrification. Both of these are first-of-their-kind analyses for Central Ohio and I’m looking forward to the opportunities they create to inform better housing policies and strategies.
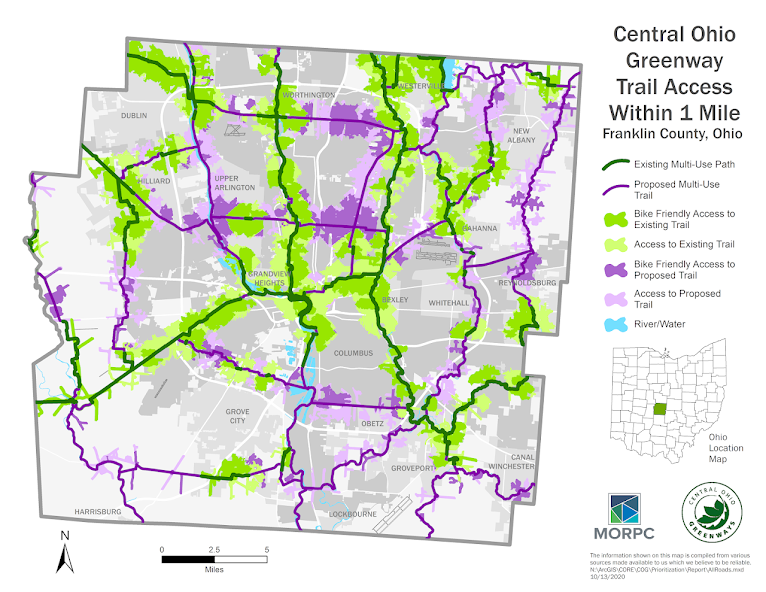
Buffer analysis for Central Ohio Greenways trail network in Franklin County, Ohio
Currently we are working on a project to prioritize all of the proposed projects for the Central Ohio Greenways (COG) trail network in Franklin County. Through analysis of our bikeway and road networks, we developed walksheds and bikesheds for the entire existing and proposed COG network. We are now developing a set of indices that can be used to evaluate the relative impact of building any given segment of proposed trail. The indices will measure a diverse range of factors including connectivity, social equity, environment, and the economy.
The geospatial project I am most excited about is one that will get underway before the end of this year. We will be working with Esri and their ArcGIS Urban platform to create a 3D base map and scenario planning tool for Central Ohio. Franklin County will be the pilot area, with plans to expand out to surrounding counties in the future. Using the latest high-resolution LiDAR data and building footprints, we will work with Esri staff to build the base 3D model and incorporate existing land use and zoning data. ArcGIS Urban allows for various planning and development scenarios to be “built” on the base model, and provides robust data analysis capabilities. This tool will help us to visualize and better understand the impacts of potential new developments across the region.
Several partners have come together to help fund the project and are committed to using it in planning efforts going forward; the partners include MORPC, City of Columbus, City of Dublin, City of Westerville, COTA, and Ohio State. Once it is launched, anyone will be able to access and view the model, and any local government with its own ArcGIS Urban seats will be able to contribute their own future plans and development back to the regional model.
Data & Mapping staff stop for a selfie after a retreat, where we volunteered at a community garden and then went for a hike. We like to do good work and keep it fun!
Thank you, Aaron for the great interview!
Check out MORPC’s datasets in the BTAA Geoportal here.
Have questions about the BTAA geoportal, or maps and geospatial data in general? Please don’t hesitate to contact our project team!